Sometimes you have to insert into a database some binary information(like images). The MS SQL data type for this kind of data is image. Very often you want to know the exact size or length of the data you have in that comlumn.
The SQL function that returns the "number of bytes used to represent any expression" is DATALENGTH ( expression ) .
As an example:
SELECT DATALENGTH(MyImage), ImageID
FROM MyImagesTable
Monday, April 21, 2008
Sunday, April 20, 2008
Creation of Joukowski airfoils
One of the most nice and usefull airfoils constructions is the creation of the Joukowski airfoils. This construction uses conformal map theory.
 We notice that the upper transformation is a geometric sum of two transformations :
  (the circle K is transforme in itself), and
  , a inversion. The last transformation will rezult into a circle K' that intersects the Ox axis in a point B(-l,0), because the inverse is . If we draw the simetric radius OP and OP’, P on the base circle K and P’ on the transformed circle, the point P’’ on the airfoil, is obtained making the vectorial sum
  . These kind of airfils are used as the base airfoils for the aircrafts wings.
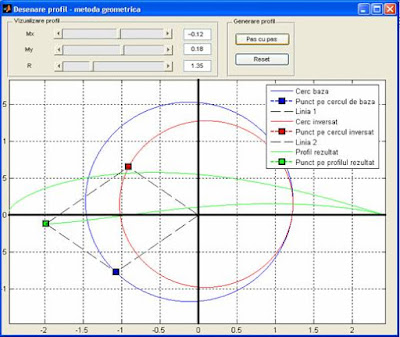
The airfoil obtained with this method is also named Joukowski-Ceaplîghin airfoil.
The method is described below:
To obtain a Joukowski airfoil, with one face concave, we take a circle K, with the center in the first dial and let K’ be the transformed circle obtained using the transformation - the circle inversion with the following formula:
We notice that the upper transformation is a geometric sum of two transformations :  (the circle K is transforme in itself), and
 , a inversion. The last transformation will rezult into a circle K' that intersects the Ox axis in a point B(-l,0), because the inverse is . If we draw the simetric radius OP and OP’, P on the base circle K and P’ on the transformed circle, the point P’’ on the airfoil, is obtained making the vectorial sum
 . These kind of airfils are used as the base airfoils for the aircrafts wings.
The following source code generates a airfoil in Matlab.
function profil = draw_airfoil(ox,oy,rho)
%point index
persistent index;
if isempty(index)==1
index = 1;
end
%transform factor-the intersection of the base circle with Ox
l=abs(ox-sqrt(rho^2-oy^2));
%obtinere cerc de baza
theta = 0:0.1:360;
theta=theta*pi/180;
px = ox + R*cos(theta);
py = oy + R*sin(theta);
cla;
grid on;
box on;
axis equal;
plot(px,py);%base circle
plot(px(index),py(index),'--bs','LineWidth',2,...
'MarkerEdgeColor','k',...
'MarkerFaceColor','b',...
'MarkerSize',10); %point on the circle
line('XData', [0 px(index)], 'YData', [0 py(index)], 'LineStyle', '--');
hold on;
%circle inversion
z=px+i*py;
csi = (l^2)./z;
plot(real(csi), imag(csi), 'Color','red'); % transformed circle
plot(real(csi(index)),imag(csi(index)),'--rs','LineWidth',2,...
'MarkerEdgeColor','k',...
'MarkerFaceColor','r',...
'MarkerSize',10);%point on the inverse circle
line('XData', [0 real(csi(index))], 'YData', [0 imag(csi(index))], 'LineStyle', '--');
hold on;
if index >= length(z)
index = 1;
end
%the resulted airfoil
plot(real(z(1:index))+real(csi(1:index)),imag(z(1:index))+imag(csi(1:index)), 'Color', 'green');
plot(real(z(index))+real(csi(index)),imag(z(index))+imag(csi(index)),'--gs','LineWidth',2,...
'MarkerEdgeColor','k',...
'MarkerFaceColor','g',...
'MarkerSize',10);
line('XData', [real(z(index))+real(csi(index)) real(z(index))], 'YData', [imag(z(index))+imag(csi(index)) imag(z(index))], 'LineStyle', '--');
line('XData', [real(z(index))+real(csi(index)) real(csi(index))], 'YData', [imag(z(index))+imag(csi(index)) imag(csi(index))], 'LineStyle', '--');
legend('Base circle','Point on the base circle','Line 1',...
'Inverted circle', 'Point on the inverted circle', 'Line 2',...
'Airfoil', 'Point on the airfoil');
index=index+50;
The output of this code is :

Subscribe to:
Posts (Atom)