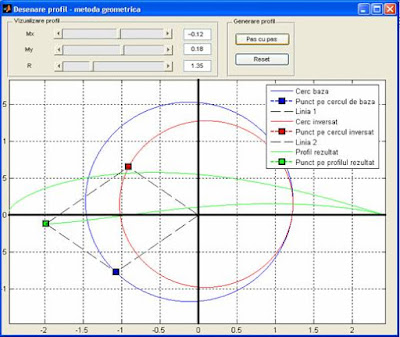
The airfoil obtained with this method is also named Joukowski-Ceaplîghin airfoil.
The method is described below:
To obtain a Joukowski airfoil, with one face concave, we take a circle K, with the center in the first dial and let K’ be the transformed circle obtained using the transformation - the circle inversion with the following formula:
 We notice that the upper transformation is a geometric sum of two transformations :
  (the circle K is transforme in itself), and
  , a inversion. The last transformation will rezult into a circle K' that intersects the Ox axis in a point B(-l,0), because the inverse is . If we draw the simetric radius OP and OP’, P on the base circle K and P’ on the transformed circle, the point P’’ on the airfoil, is obtained making the vectorial sum
  . These kind of airfils are used as the base airfoils for the aircrafts wings.
The following source code generates a airfoil in Matlab.
function profil = draw_airfoil(ox,oy,rho)
%point index
persistent index;
if isempty(index)==1
index = 1;
end
%transform factor-the intersection of the base circle with Ox
l=abs(ox-sqrt(rho^2-oy^2));
%obtinere cerc de baza
theta = 0:0.1:360;
theta=theta*pi/180;
px = ox + R*cos(theta);
py = oy + R*sin(theta);
cla;
grid on;
box on;
axis equal;
plot(px,py);%base circle
plot(px(index),py(index),'--bs','LineWidth',2,...
'MarkerEdgeColor','k',...
'MarkerFaceColor','b',...
'MarkerSize',10); %point on the circle
line('XData', [0 px(index)], 'YData', [0 py(index)], 'LineStyle', '--');
hold on;
%circle inversion
z=px+i*py;
csi = (l^2)./z;
plot(real(csi), imag(csi), 'Color','red'); % transformed circle
plot(real(csi(index)),imag(csi(index)),'--rs','LineWidth',2,...
'MarkerEdgeColor','k',...
'MarkerFaceColor','r',...
'MarkerSize',10);%point on the inverse circle
line('XData', [0 real(csi(index))], 'YData', [0 imag(csi(index))], 'LineStyle', '--');
hold on;
if index >= length(z)
index = 1;
end
%the resulted airfoil
plot(real(z(1:index))+real(csi(1:index)),imag(z(1:index))+imag(csi(1:index)), 'Color', 'green');
plot(real(z(index))+real(csi(index)),imag(z(index))+imag(csi(index)),'--gs','LineWidth',2,...
'MarkerEdgeColor','k',...
'MarkerFaceColor','g',...
'MarkerSize',10);
line('XData', [real(z(index))+real(csi(index)) real(z(index))], 'YData', [imag(z(index))+imag(csi(index)) imag(z(index))], 'LineStyle', '--');
line('XData', [real(z(index))+real(csi(index)) real(csi(index))], 'YData', [imag(z(index))+imag(csi(index)) imag(csi(index))], 'LineStyle', '--');
legend('Base circle','Point on the base circle','Line 1',...
'Inverted circle', 'Point on the inverted circle', 'Line 2',...
'Airfoil', 'Point on the airfoil');
index=index+50;
The output of this code is :

No comments:
Post a Comment